How to setup the Monitoring for Golden
Gate Processes
In this post I will run you thru the process on how to setup monitoring for your
golden-gate processes. I am sure you will find it helpful as I didn't come across
any sites providing that info with details so I thought it will be useful for some...
i.
To setup
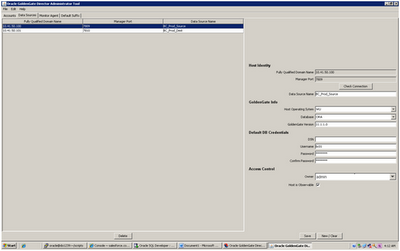
monitoring first you need to setup the Data source using GG Director GDSC Admin
console.
Open
the director console and enter username and password as follows
User name – admin
Password – admin
Server – <IP of GG Director>:7001
This assumes you are using the default port of 7001 for the GG Director
Go to Data Sources Tab and enter the
information in the RHS pane as follows.
Note
– You need to two data sources here, one for source and one for destination.
Add another data
source and add the information as follows.
Once both the data
sources are added successfully, you need to close the admin tool.
Open the GG Director
console and enter the username, password and server information once again.
Once in, open the new
diagram from File menu.
Click on Actions à Add data source à [Name of the source
data source]
Click on Actions à Add data source à [Name of the destination
data source]
Once done , you can see
both the data sources on the diagram
You can see all the
processes and their relative components stacked on each other as follows.
Hence
you need to organize them properly as shown in the next slide.
You can see now that all the extract and replicat processes running on those particular hosts.
Here bc01_XXX processes are for Production and bc_XXX processes are UAT environment.
To setup the
monitoring, you need to look at the second half of the pane.
Click
on My Alerts tab. This will show you
the list of option you can configure for you respective data source.
Check
each option and fill in the information as per your requirements. (Check
following slides for more information)
Enter the corresponding values as displayed in screen
select the specific event type as per your requirements. you can also define your custom email handler if you do not wish to use the default one.
That't it. You have now successfully configured the monitoring for your existing extracts, replicats in your golden gate environment.
To test the functionality stop any of the processes and wait for the 1-2 minutes to see if you receive the notification or not. If you still not the get the notification and alert is generated check the configuration of your mail server.


No comments:
Post a Comment